|
|
|
|
|
|
|
|
|
|
|
|
|
|
Functional
Genome Analysis (B070)
Deutsches
Krebsforschungszentrum,
Im Neuenheimer Feld 580
D-69120
Heidelberg,
Germany. |

|
|
|
|
|
|
|
|
|
|
|
|
..
..
|
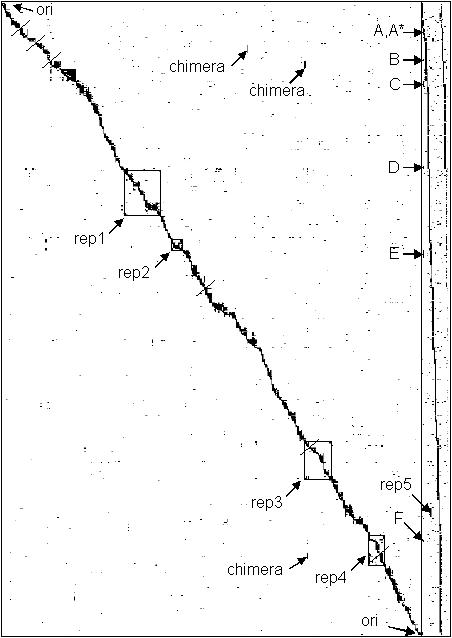
Physical
map of the Pseudomonas putida genome.
In
the two-dimensional
matrix, 362 hybridisation probes are arranged as columns, while 3620
clones
are arranged in rows. A positive hybridisation signal is represented by
a black spot at the respective cross-section. The entire data set is
presented,
including all false positive or negative results. The maps starts and
ends
at the origin of replication (ori). Gaps in the contig coverage are
indicated
by lines across the diagonal.
On
the right margin,
the results obtained from hybridising genomic restriction fragments are
shown; they are ordered left to right according to their position in
the
macro-restriction maps produced with SwaI and I-CeuI, respectively.
These
data were not immediately taken into account for the actual clone
ordering
process but served as an independent control of co-linearity.
Hybridising
a short fragment resulting from the SwaI-digest of genomic DNA, the
positions
of the ribosomal operon were highlighted (rDNA: A*, A-F).
The position of four
other repetitive sequences (rep1 to rep4) and the cross-hybridisation
patterns
produced by three chimeric clones (chimera) are indicated. The reason
for
a cross-hybridisation of a genomic fragment with a specific but
unrelated
area (rep5) is unknown; no such effect could be observed in any of the
relevant cosmid probe hybridisations.
|
|
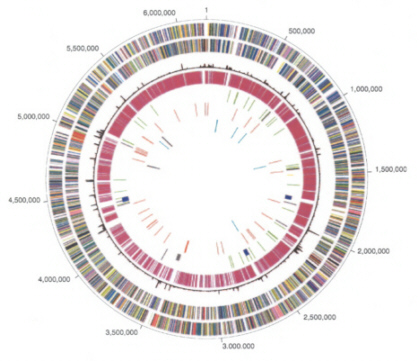
Circular representation
of the
P. putida KT2440
genome.
Outer
circle, predicted
coding regions on the plus strand colour coded by role categories:
salmon,
amino acid biosynthesis; light blue, biosynthesis of cofactors,
prosthetic
groups and carriers; light green, cell envelope; red, cellular
processes;
brown, central intermediary metabolism; yellow, DNA metabolism; green,
energy metabolism; purple, fatty acid and phospholipid metabolism;
pink,
protein fate/synthesis; orange, purines, pyrimidines, nucleosides,
nucleotides;
blue, regulatory functions; grey, transcription; teal, transport and
binding
proteins; black, hypothetical and conserved hypothetical proteins.
Second
circle, predicted coding regions on the minus strand colour coded by
role
categories. Third circle, atypical trinucleotide composition of the
genome.
Fourth circle, top hits to the P. aeruginosa genome (P < 10-60).
Fifth
circle, transposable elements (green), phage regions (blue), pyocins
(yellow).
Sixth circle, tRNAs in red. Seventh circle,rRNAs in blue, and
structural
RNAs in black.
Nelson et al. (2002) Environ. Microbiol.
4,
799-808. 
|
|
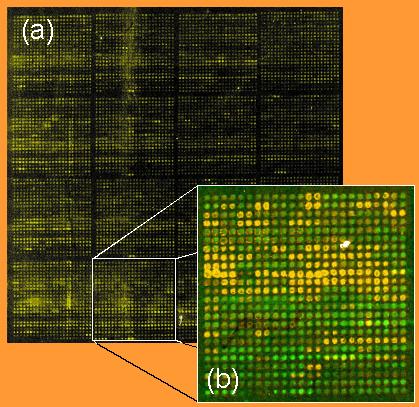
Preparation of
a Pseudomonas putida microarray.
From
the complete
genomic sequence, a minimal set of shotgun clones was defined that
represents
a minimal tiling path accross the entire genome.
Microarray analysis
of genomic DNA. (a) Only one half of a microarray is shown.
PCR-products
were spotted in duplicate onto poly-L-lysine slides. Cy5- and
Cy3-labelled
DNA-target was made from genomic DNA of two samples of strain KT2440
kindly
provided by Soeren Molin (BioCentrum-DTU, Lyngby, Denmark) and Kenneth
Timmis and Edward Moore (GBF, Braunschweig, Germany), respectively. Any
genomic difference between the two
samples
should show up as a red or green
signal, respectively. As can be judged by the yellow colour of all
spots,
no discernal difference in genomic representation was identified.
Overall
signal intensity varied across the microarray due to differences in the
amount of PCR-product present at the individual positions. However, on
close scrutiny, all positions with PCR-product gave rise to a signal.
In
(b), difference in genome content can be seen for one square of the
microarray
comparing samples of strain P. pudita KT2440, labelled green,
and P.
fluorescens, labelled red. Since the microarray represents the
KT2440
genome, only the lack of such sequence in the P. fluorescens
genome
could be detected, indicated by a green signal.
Stjepandic et
al. (2002) Environ. Microbiol. 4,
819-823.
|
.
..
..
|
